Chart: Population Coverage of Fortified Food Vehicle in Countries with Mandatory Fortification
Chart ID: 2206
How to Interpret this Visualization
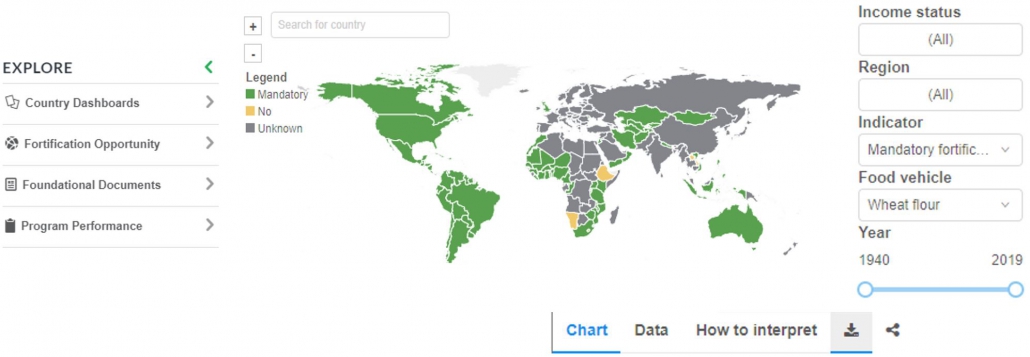
This interactive chart displays the proportion of the country’s population that reportedly eats the fortified food vehicle in question. Where available, coverage of that fortified food is compared to the total population (all households) as well as only to households that report using that food (households with food). This distinction is important since households that do not use a food cannot be considered potential beneficiaries if that food is fortified. See also the GFDx indicator “Population Coverage of Food Vehicle” under the “Context for Fortified Food Vehicle Coverage in the Population” visualization. For example, if they are primarily cassava eating, fortification of wheat flour may not benefit them. Including those households in a denominator reduces the estimated coverage, and impacts the interpretation of a program’s coverage. The bar chart only displays coverage data for countries with mandatory fortification of the selected food vehicle. Hover the bar chart to see more details on population coverage. You may filter by income status, geographic region, country, year, food vehicle, and coverage type. Country classifications of income status and region are from the World Bank and UN, respectively.
Sources and Contributors
The source is the author, name and publication information of the country-specific document. Use the “download” link to view all data and original sources.
Suggested Citation: Global Fortification Data Exchange. Chart: Population Coverage of Fortified Food Vehicle in Countries with Mandatory Fortification. Accessed dd/month/yyyy. [http://www.fortificationdata.org.]