• English
  • Español
Global Fortification Data Exchange | GFDx
  • #foodfortification #GFDx
  • Youtube
  • Twitter
  • Mail
  • About Us
    • Introduction
    • About Fortification
    • About the GFDx
    • Who we are
    • Share your data
    • Contact form
  • Countries
  • Data
    • Country dashboards
    • Visualizations
    • Full datasets
  • Methods and Sources
    • Methodology
    • Data contributors
  • Media Center
  • Resources
    • Fortification Resources
    • How to use the GFDx
    • FAQs
  • Subscribe to our newsletters!
  • Menu Menu

Explore

  • Country Dashboards
    • Fortification Overview
    • Review of Foundational Documents
  • Fortification Opportunity
    • Food Intake/Availability
      • Per Capita: Food Intake and Availability
      • By Country: Total Food Availability
    • Proportion of Food Industrially Processed
      • By Country: Quantity and Proportion of Industrially Processed Food Vehicles
      • By Year: Quantity and Proportion of Industrially Processed Food Vehicles
    • Proportion of Population Consuming Food
      • Context for Food Vehicle Coverage in the Population
  • Foundational Documents
    • Legislation Status
      • Fortification Legislation
      • Year When Food Fortification Mandated
      • Fortification Legislation Scope in Countries with Mandatory Fortification
    • Fortification Standards
      • Number of Food Vehicles with Standards
      • Nutrient Levels in Fortification Standards [mid-range or average]
      • Count of Nutrients in Standards
      • Alignment of National Fortification Standards with WHO recommendations (nutrient compounds)
      • Comparison of National Fortification Standards with WHO recommendations (nutrient levels)
    • Regulatory Monitoring Protocols
      • Presence of Regulatory Monitoring Protocols for External and Import Monitoring
  • Program Performance
    • Fortification Compliance/Quality
      • Quantity and Proportion of Food Vehicle that is Fortified
    • Proportion of Population Consuming Fortified Food
      • Population Coverage of Fortified Food Vehicle in Countries with Mandatory or Voluntary Fortification
    • Potential Nutrient Contribution From Fortification
      • Potential Nutrient Intake From Fortification
    • Health Status Before and After Fortification
      • Availability of Data on Health Status Before and After Mandatory Fortification
  • How To Use
See more…
  • Chart: Total Food Availability

    Chart showing total annual food supply available for human consumption by country (Use this chart to identify total annual food availability of maize flour, oil, salt, rice, or wheat flour in a country)

    Chart: Quantity and Proportion of Industrially Processed Food Vehicles 

    Chart showing the total quantity and proportion of each food vehicle that is industrially processed by country

    Chart: Context for Fortified Food Vehicle Coverage in the Population

    Chart of the proportion of a country’s population reported to consume a fortified food vehicle, compared to the population consuming that food (fortified or not), compared to the entire population

  • Chart: Quantity and Proportion of Industrially Processed Foods by Year

    Chart displaying the total quantity and proportion of each industrially processed food vehicle in a country by year

    Map: Presence of external and import monitoring protocols

    Whether countries with mandatory fortification legislation have the applicable protocols to monitor the domestic production (external monitoring) or importation (import monitoring) of fortified foods. The presence of a monitoring protocol indicates that a country has identified procedures to carry out external and/or import monitoring of food fortification. If a country lacks an external and/or import monitoring protocol, it would suggest that a basic foundational document for the implementation of food fortification programs is missing.

    Map: Quantity and Proportion of Food Vehicle that is Fortified

    Map of the total quantity and proportion of a food vehicle that is fortified

  • Map: Food Intake and Availability

    Map counting the number of nutrients required in food vehicles by country (Use this map to identify by country how many nutrients are required in mandatory or voluntary standards for maize flour, oil, salt, rice, and/or wheat flour)

    Map: Population Coverage of Fortified Food Vehicle in Countries with Mandatory or Voluntary Fortification

    Map of the proportion of a country’s population with access to the fortified food vehicle

  • Chart: Year When Food Fortification Mandated

    Chart of the number of countries with mandatory food fortification over time (Use this chart to identify when a country first passed mandatory fortification of maize flour, oil, salt, rice, and/or wheat flour)

    Plot: Fortification Legislation Scope in Countries with Mandatory Fortification

    Plot displaying the scope of fortification legislation, which includes information on whether all food vehicle types or a subset are required to be fortified and whether mandatory legislation requires food vehicles of different origins/destinations and intended uses to be fortified

    Map: Fortification Legislation

    Map of legal status of food fortification by country (Use this map to identify which countries have mandatory and voluntary legislation for the fortification of maize flour, oil, rice, salt, and/or wheat flour)

  • Map: Number of Food Vehicles with Standards

    Map counting the number of food vehicles with fortification standards by country (Use this map to identify by country how many of the following foods have mandatory or voluntary standards: maize flour, oil, salt, rice, and/or wheat flour)

    Map: Count of Nutrients in Standards

    Map counting the number of nutrients required in food vehicles by country (Use this map to identify by country how many nutrients are required in mandatory or voluntary standards for maize flour, oil, salt, rice, and/or wheat flour)

    Map: Nutrient Levels in Fortification Standards [mid-range or average]

    Map displaying the amount of each nutrient required in food vehicles by country (Use this map to identify by country nutrient levels required in mandatory or voluntary standards for maize flour, oil, salt, rice, or wheat flour)

  • Map: Availability of Data on Health Status Before and After Mandatory Fortification

    The purpose of mandatory food fortification is to improve health outcomes in a population. Health improvements can be measured in changes in blood biomarkers and/or changes in functional outcomes that are caused by a deficiency in a nutrient. This visualization presents the number of countries that have data or studies comparing health status before and after mandatory fortification.

    GFDx Analysis: Alignment of national fortification standards with WHO guidelines (nutrient compounds)

    Nutrients can be added in fortification as different chemical forms (compounds). This visualization compares the nutrient compounds specified in national fortification standards to those recommended in WHO guidelines.

    GFDx Analysis: Comparison of national fortification standards with WHO guidelines (nutrient levels)

    Nutrient amounts (or levels) added in fortification should contribute meaningfully to dietary intake. This visualization compares nutrient levels specified in national fortification standards to those recommended in WHO guidelines. Results from this analysis should be used as a starting point for policymakers to discuss whether national fortification requirements are as safe and effective as possible.

  • GFDx Analysis: Potential nutrient intake under ideal (unadjusted) and real-life (adjusted for program implementation data, where available) scenarios

    This visualization calculates the potential intake of nutrients included in fortification standards based on food intake/availability information. Data is presented under the ideal scenario that all food can and has been fortified, as well as real-life scenario that adjusts data for the proportion of food that can be fortified (i.e., is industrially milled) and the proportion of food that has been fortified (i.e., compliance, quality, or expert opinion data), if this data is available.

PreviousNext
© Copyright - Global Fortification Data Exchange

Subscribe to the GFDx

* indicates required


Suscribirse al GFDx

* indica requerido


Welcome to the GFDx, an analysis and visualization tool for data on food fortification!

Food fortification adds essential vitamins and minerals, called micronutrients, to commonly consumed foods to prevent nutritional deficiencies. We call these commonly consumed foods that can be fortified food vehicles because they “deliver” nutrients.

Food fortification is one of the most scalable, sustainable and cost-effective interventions to combat micronutrient malnutrition.

Vitamin and mineral deficiencies affect people globally – impacting their health and limiting their ability to contribute to the economic well-being of their communities and countries.

Designed for, and by the fortification community, the GFDx provides all the data necessary to track global progress on food fortification, and to enable decision makers to use data to improve the quality of national fortification programs.

Country Dashboards & Interactive Maps, Charts, Tables and Plots

The GFDx aggregates and visualizes data on five commonly fortified foods: maize flour, oil, rice, salt, and wheat flour.

The GFDx includes indicators on food fortification legislation from 1940 to present, fortification standards, and food availability and intake, legislation scope, proportion of foods industrially processed, availability of regulatory monitoring protocols, fortification quality, and population coverage for 196 countries.

Within the GFDx site, you are able to view Country Dashboards, use and share interactive maps, charts, tables, plots, and customize visualizations or download data for offline analysis.

How to view country Dashboards

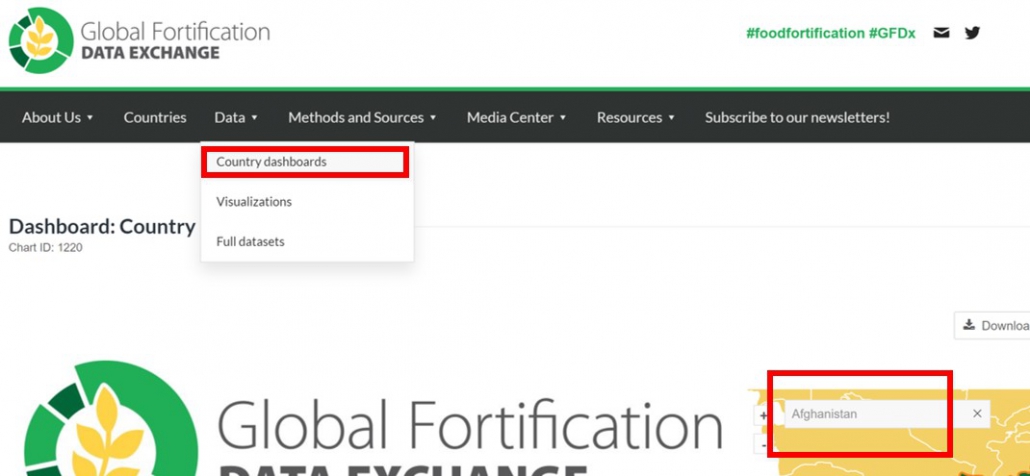
Under Data on the homepage, you will find our “Country Fortification Dashboards”. Once you are on a country dashboard, you can search for other countries in the map using the search bar:

You can download as a PDF, or share with others. You can also return to the home page and click on “Countries” for a full list of country dashboard links, organized by global region:

How to customize maps and charts

Also under Data on the homepage, you will find our interactive maps, charts and plots.

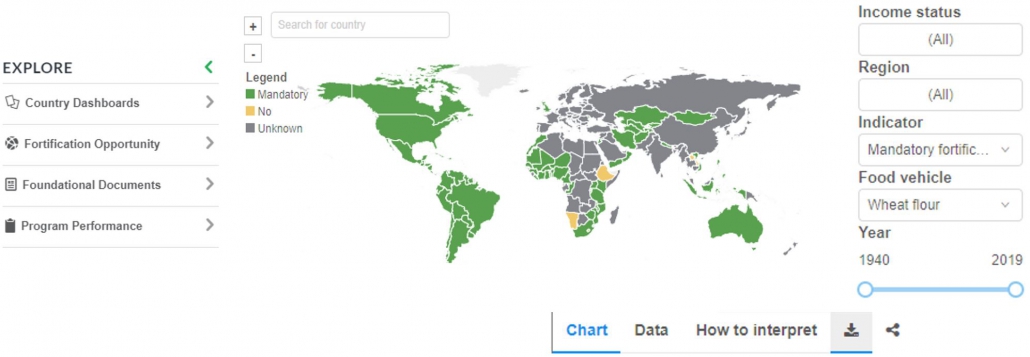
Use the filter options on the right-hand side of the map, chart or plot of charts to customize based on your data needs. Explore other indicators by navigating the EXPLORE section on the left hand side.

How to interpret visualizations, share and download

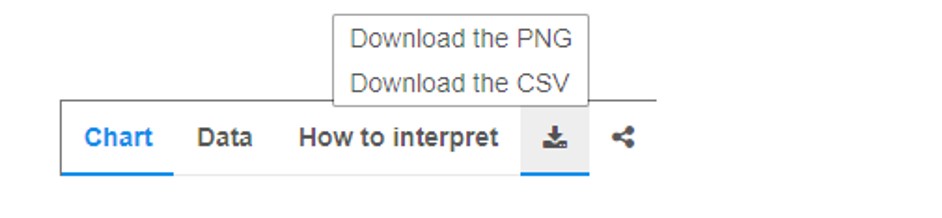
In the tabs below each visualization, you can view a table of the data, understand how to interpret the visualization. You can also download data as a CSV, download a PNG image, or share your customized visualization

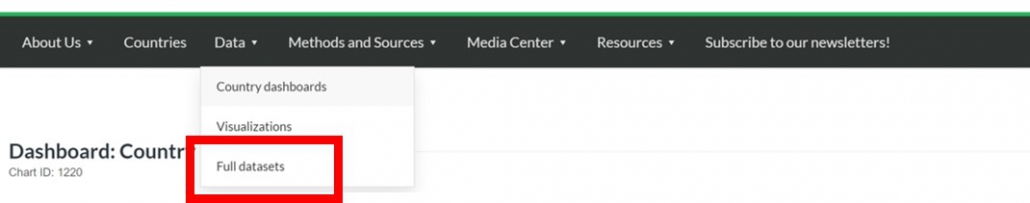
You can also download all data by returning to the home screen and under “Data“, clicking “Full Datasets”

Questions?

If you have any questions or would like more details, please contact the GFDx team at info@fortificationdata.org

❮ PREV
123456
NEXT ❯

Scroll to top