Food fortification adds essential vitamins and minerals, called micronutrients, to commonly consumed foods to prevent nutritional deficiencies. We call these commonly consumed foods that can be fortified food vehicles because they “deliver” nutrients.
Food fortification is one of the most scalable, sustainable and cost-effective interventions to combat micronutrient malnutrition.
Vitamin and mineral deficiencies affect people globally – impacting their health and limiting their ability to contribute to the economic well-being of their communities and countries.
Designed for, and by the fortification community, the GFDx provides all the data necessary to track global progress on food fortification, and to enable decision makers to use data to improve the quality of national fortification programs.
The GFDx aggregates and visualizes data on five commonly fortified foods: maize flour, oil, rice, salt, and wheat flour.
The GFDx includes indicators on food fortification legislation from 1940 to present, fortification standards, and food availability and intake, legislation scope, proportion of foods industrially processed, availability of regulatory monitoring protocols, fortification quality, and population coverage for 196 countries.
Within the GFDx site, you are able to view Country Dashboards, use and share interactive maps, charts, tables, plots, and customize visualizations or download data for offline analysis.
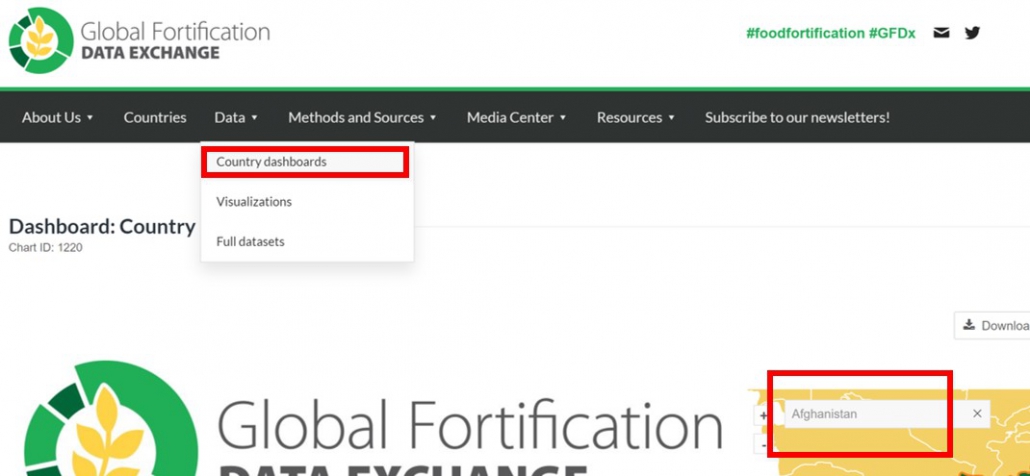
Under Data on the homepage, you will find our “Country Fortification Dashboards”. Once you are on a country dashboard, you can search for other countries in the map using the search bar:

You can download as a PDF, or share with others. You can also return to the home page and click on “Countries” for a full list of country dashboard links, organized by global region:

Also under Data on the homepage, you will find our interactive maps, charts and plots.

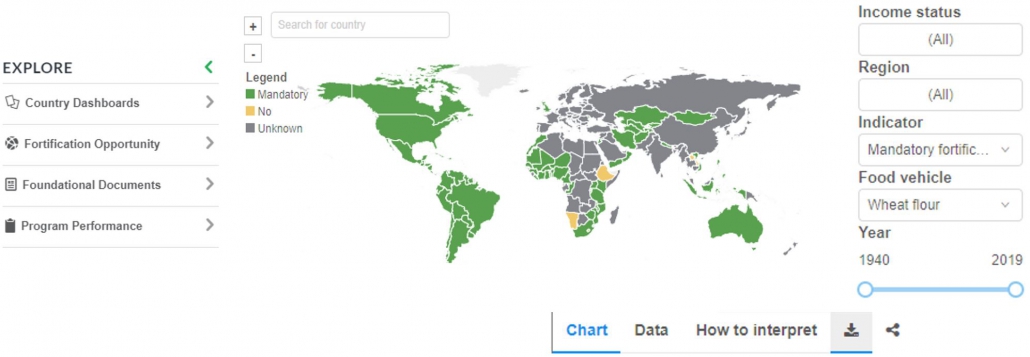
Use the filter options on the right-hand side of the map, chart or plot of charts to customize based on your data needs. Explore other indicators by navigating the EXPLORE section on the left hand side.
In the tabs below each visualization, you can view a table of the data, understand how to interpret the visualization. You can also download data as a CSV, download a PNG image, or share your customized visualization

You can also download all data by returning to the home screen and under “Data“, clicking “Full Datasets”


If you have any questions or would like more details, please contact the GFDx team at info@fortificationdata.org